How to Whiteboard: The Architectural Flow Diagramming Methodology
A practitioner's guide to dry-erase systems modeling: geometric flow styles, Rapid Application Development (RAD) velocity, color-coded chromatic discipline, spatial cognition versus digital software, and the intentional organizational psychology of cubicle engineering artifacts.
Christopher Lazok
Founder & Systems Architect · Georgetown, TX
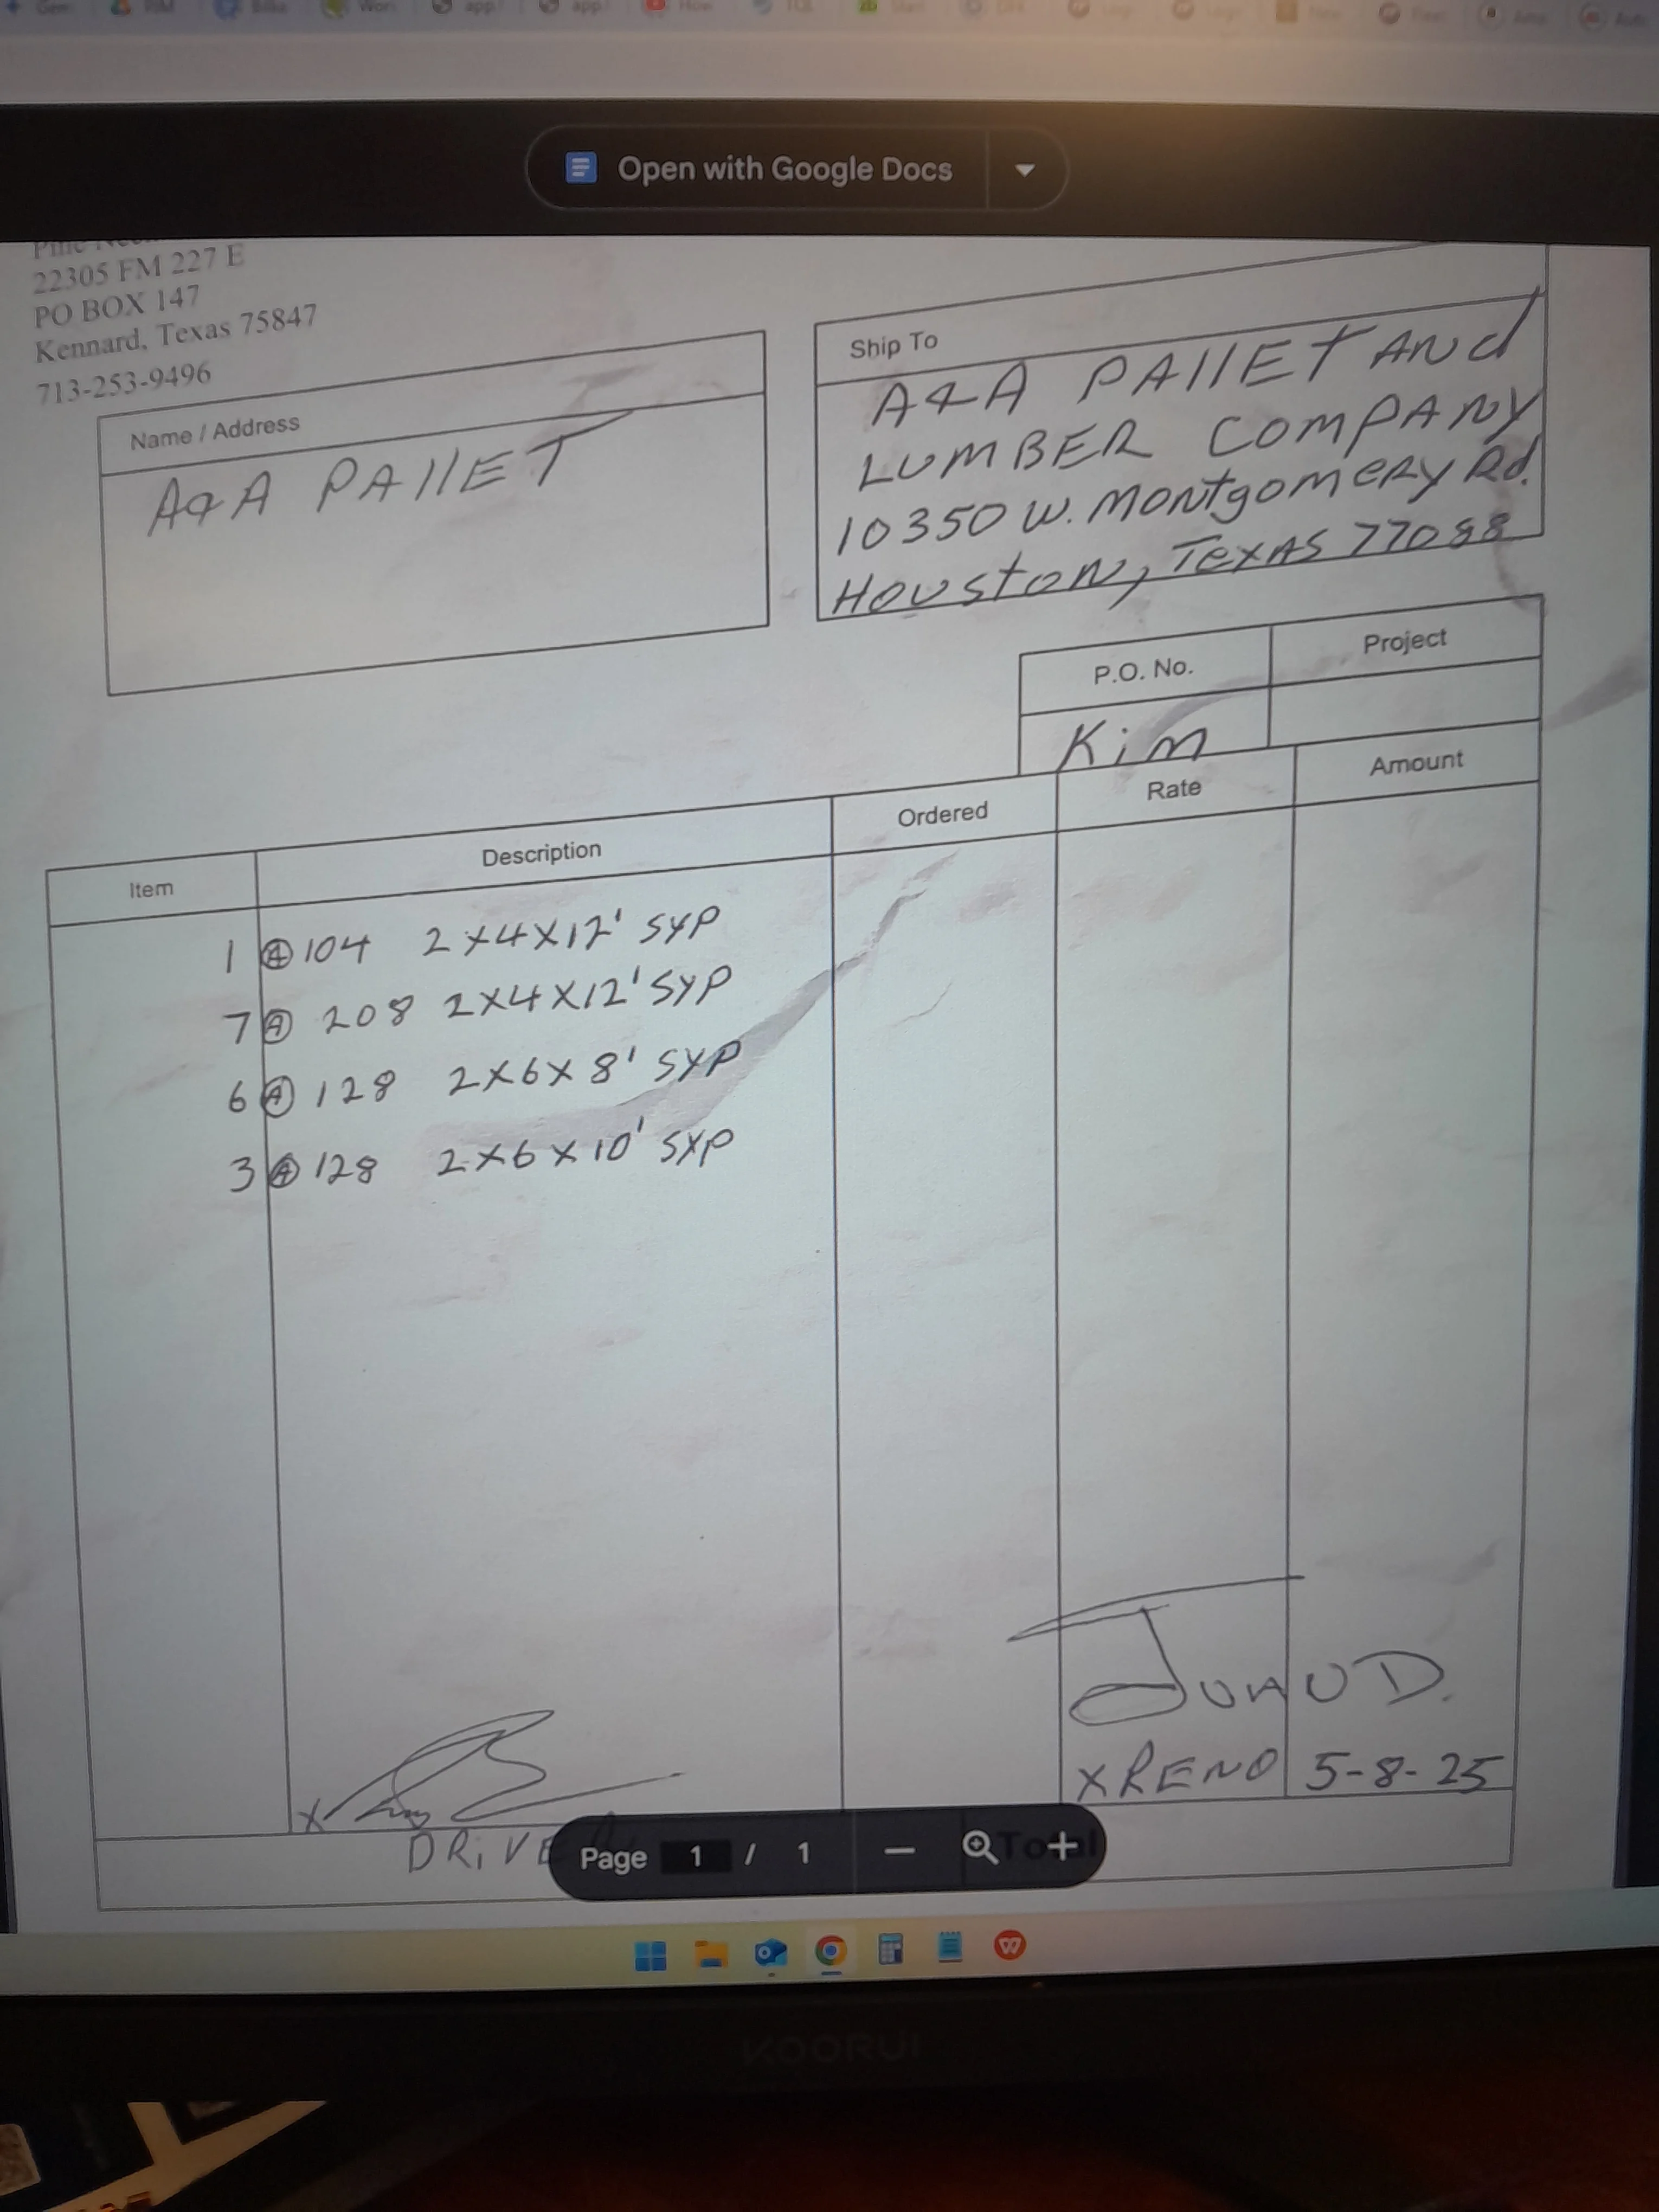
Figure 1: The cubicle whiteboard as an active cognitive workspace and organizational engineering artifact.
1. The Tactile Primacy of the Dry-Erase Board
In an era saturated with infinite-canvas vector applications, browser-based drag-and-drop flowchart tools, and automated diagram generators, the physical dry-erase whiteboard remains the most potent, high-bandwidth thinking instrument available to a systems architect. Software applications force thoughts through a narrow funnel of menu selections, grid-snapping algorithms, latency-inducing trackpad interactions, and modal configuration dialogs. By the time a user selects a stencil, adjusts a bezier curve, and formats a font, the subtle thread of high-order architectural reasoning has fragmented.
The physical whiteboard strips away every layer of friction between the architect's neurological model and the external visual plane. It is an unmediated projection surface where thoughts flow directly through the shoulder, forearm, and chisel-tip marker at zero computational latency.
Critically, whiteboarding is not an artistic showcase or a documentation delivery mechanism; it is a dynamic execution process. The value of the whiteboard lies entirely in the mechanical act of drawing, dissecting, erasing, and restructuring complex flow topologies in real time. We do not whiteboard to memorialize an idea that is already completed; we whiteboard to force an unformed mental concept to confess its architectural flaws before a single line of production code is written.
2. The Geometry and Style of Flow Diagrams
An effective architectural flow diagram possesses an unmistakable visual geometry. It is immediately distinct from casual brainstorming, meeting scribbles, or mind maps. A professional systems whiteboard adheres to a disciplined visual grammar that allows any seasoned engineer to understand the structural hierarchy and throughput dynamics purely through geometry and vector orientation.
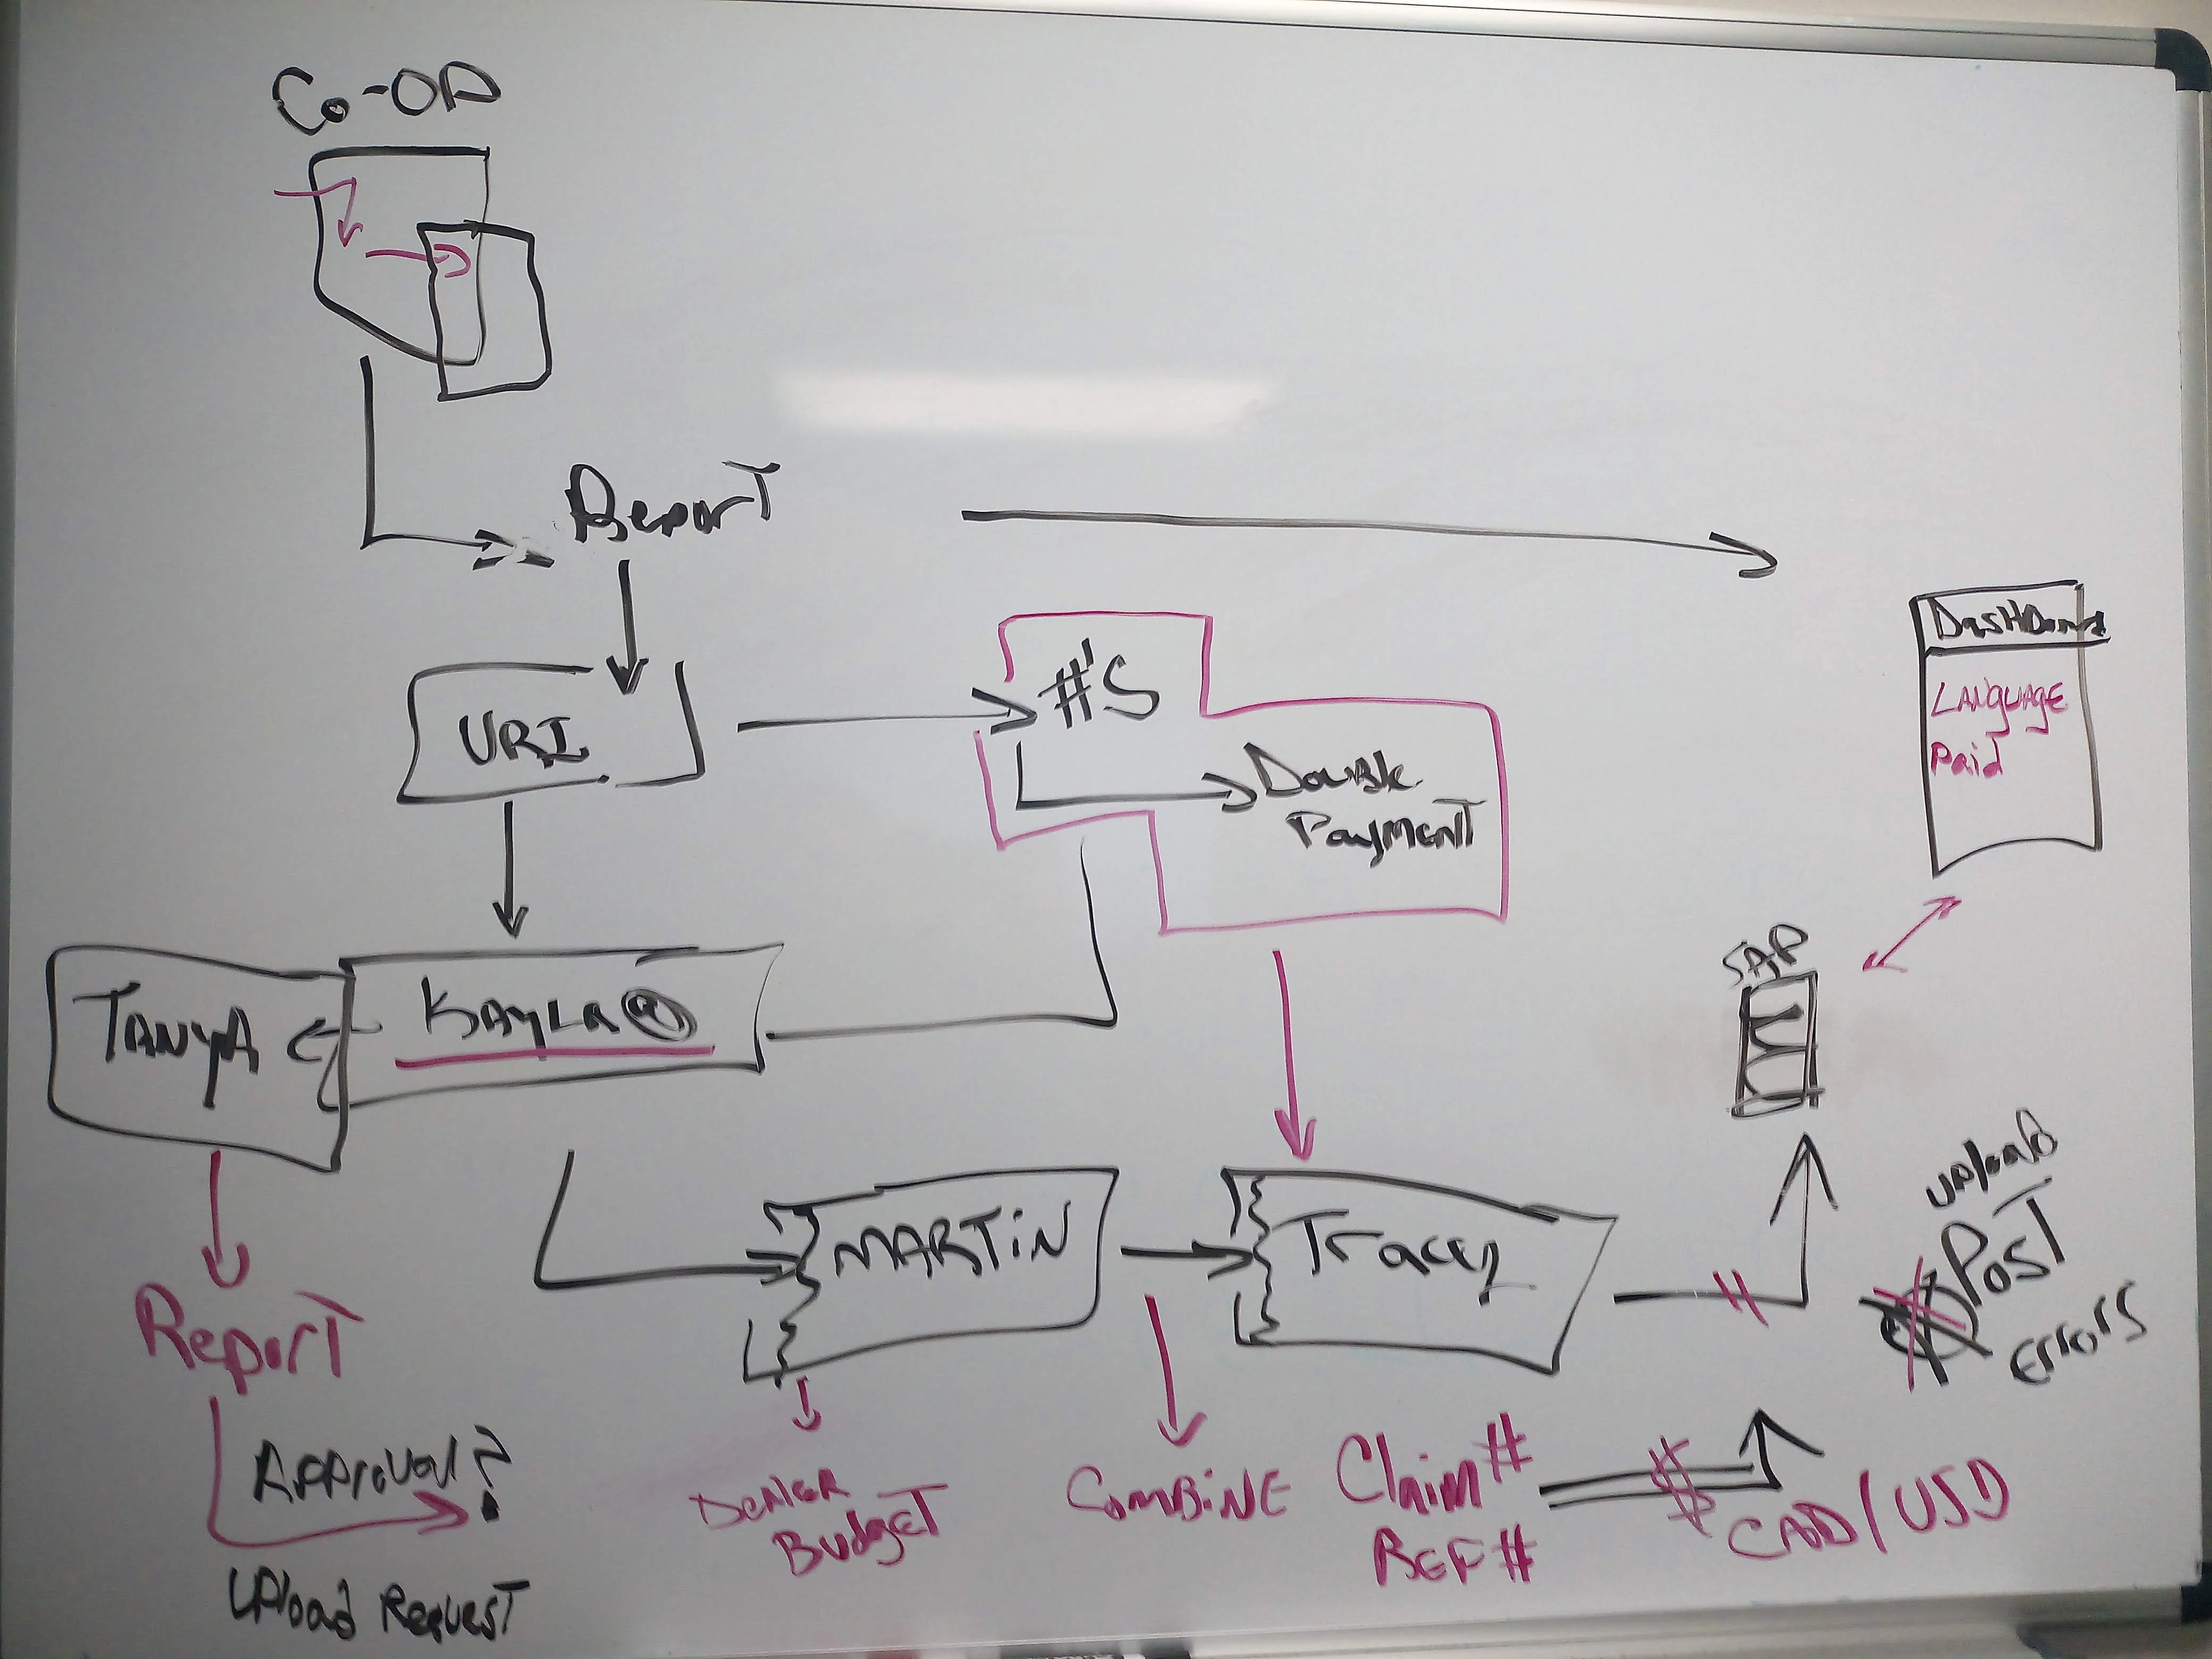
Figure 2: Modular subsystem blocks, clean vector conduits, and spatial node distribution across the board plane.
Node Semantics and Geometric Enclosures
The vocabulary of the board begins with consistent geometric shapes that communicate computational behavior at a glance:
- Sharp Rectangles (Stateless Units & Execution Services): Solid, crisp rectangular boundaries designate deterministic compute steps, data transformation workers, translation bridges, or decoupled microservices. They signify pure, stateless operations.
- Rounded Capsules & Cylinders (State Engines & Persistence Tiers): Softened corners or traditional pill shapes signal state retention—relational databases, append-only logs, key-value caches, buffer pools, or persistent local storage.
- Diamonds & Hexagonal Gates (Decision Thresholds & Routing Branches): Angled polygons denote algorithmic bifurcations, conditional evaluations, policy checks, or schema validation gates. They are junctions where an incoming vector must branch based on strict boolean criteria.
- Cloud Perimeters & Dashed Fences (External & Untrusted Boundaries): Loosely sketched cloud perimeters indicate third-party APIs, vendor networks, unauthenticated client runtimes, or asynchronous external environments outside the direct control of the host architecture.
Vector Topologies: The Grammar of Arrows
Lines and arrows are the arteries of the whiteboard; their strokes dictate temporal ordering and data contracts:
- Solid Direct Vectors: Represent synchronous, blocking request/response flows. If node A points to node B with a firm, unbroken stroke, execution halts at A until B acknowledges completion.
- Dashed or Dotted Conduits: Denote asynchronous event emission, message queue pushes, background telemetry pings, or fire-and-forget dispatches.
- Double-Headed and Heavy Parallel Vectors: Signify persistent bi-directional streaming, duplex socket connections, or continuous synchronization handshakes.
- Recursive Looping Vectors: Sweep backward from downstream nodes into upstream intake gates, visually codifying retry mechanisms, exponential backoff circuits, or iterative convergence models.
Strata and Swimlanes
Rather than letting nodes scatter randomly across the white expanse, flow architecture organizes itself into horizontal or vertical strata. An ingress layer occupies the leftmost or topmost perimeter (intake parsing, validation, edge filtering). The computation tier occupies the central expanse (transformation pipelines, business logic orchestration). The state and egress tier dominates the opposing edge (storage persistence, analytics ingestion, message bus publication). Establishing these spatial strata ensures that entropy cannot overtake the board as complexity scales.
3. Rapid Application Development (RAD) Through Whiteboarding
Rapid Application Development (RAD) prioritizes rapid prototyping, iterative refinement, and dynamic adaptability over rigid, long-term upfront documentation cycles. In a RAD workflow, the whiteboard is not a secondary planning aid—it is the primary engine of architectural velocity.
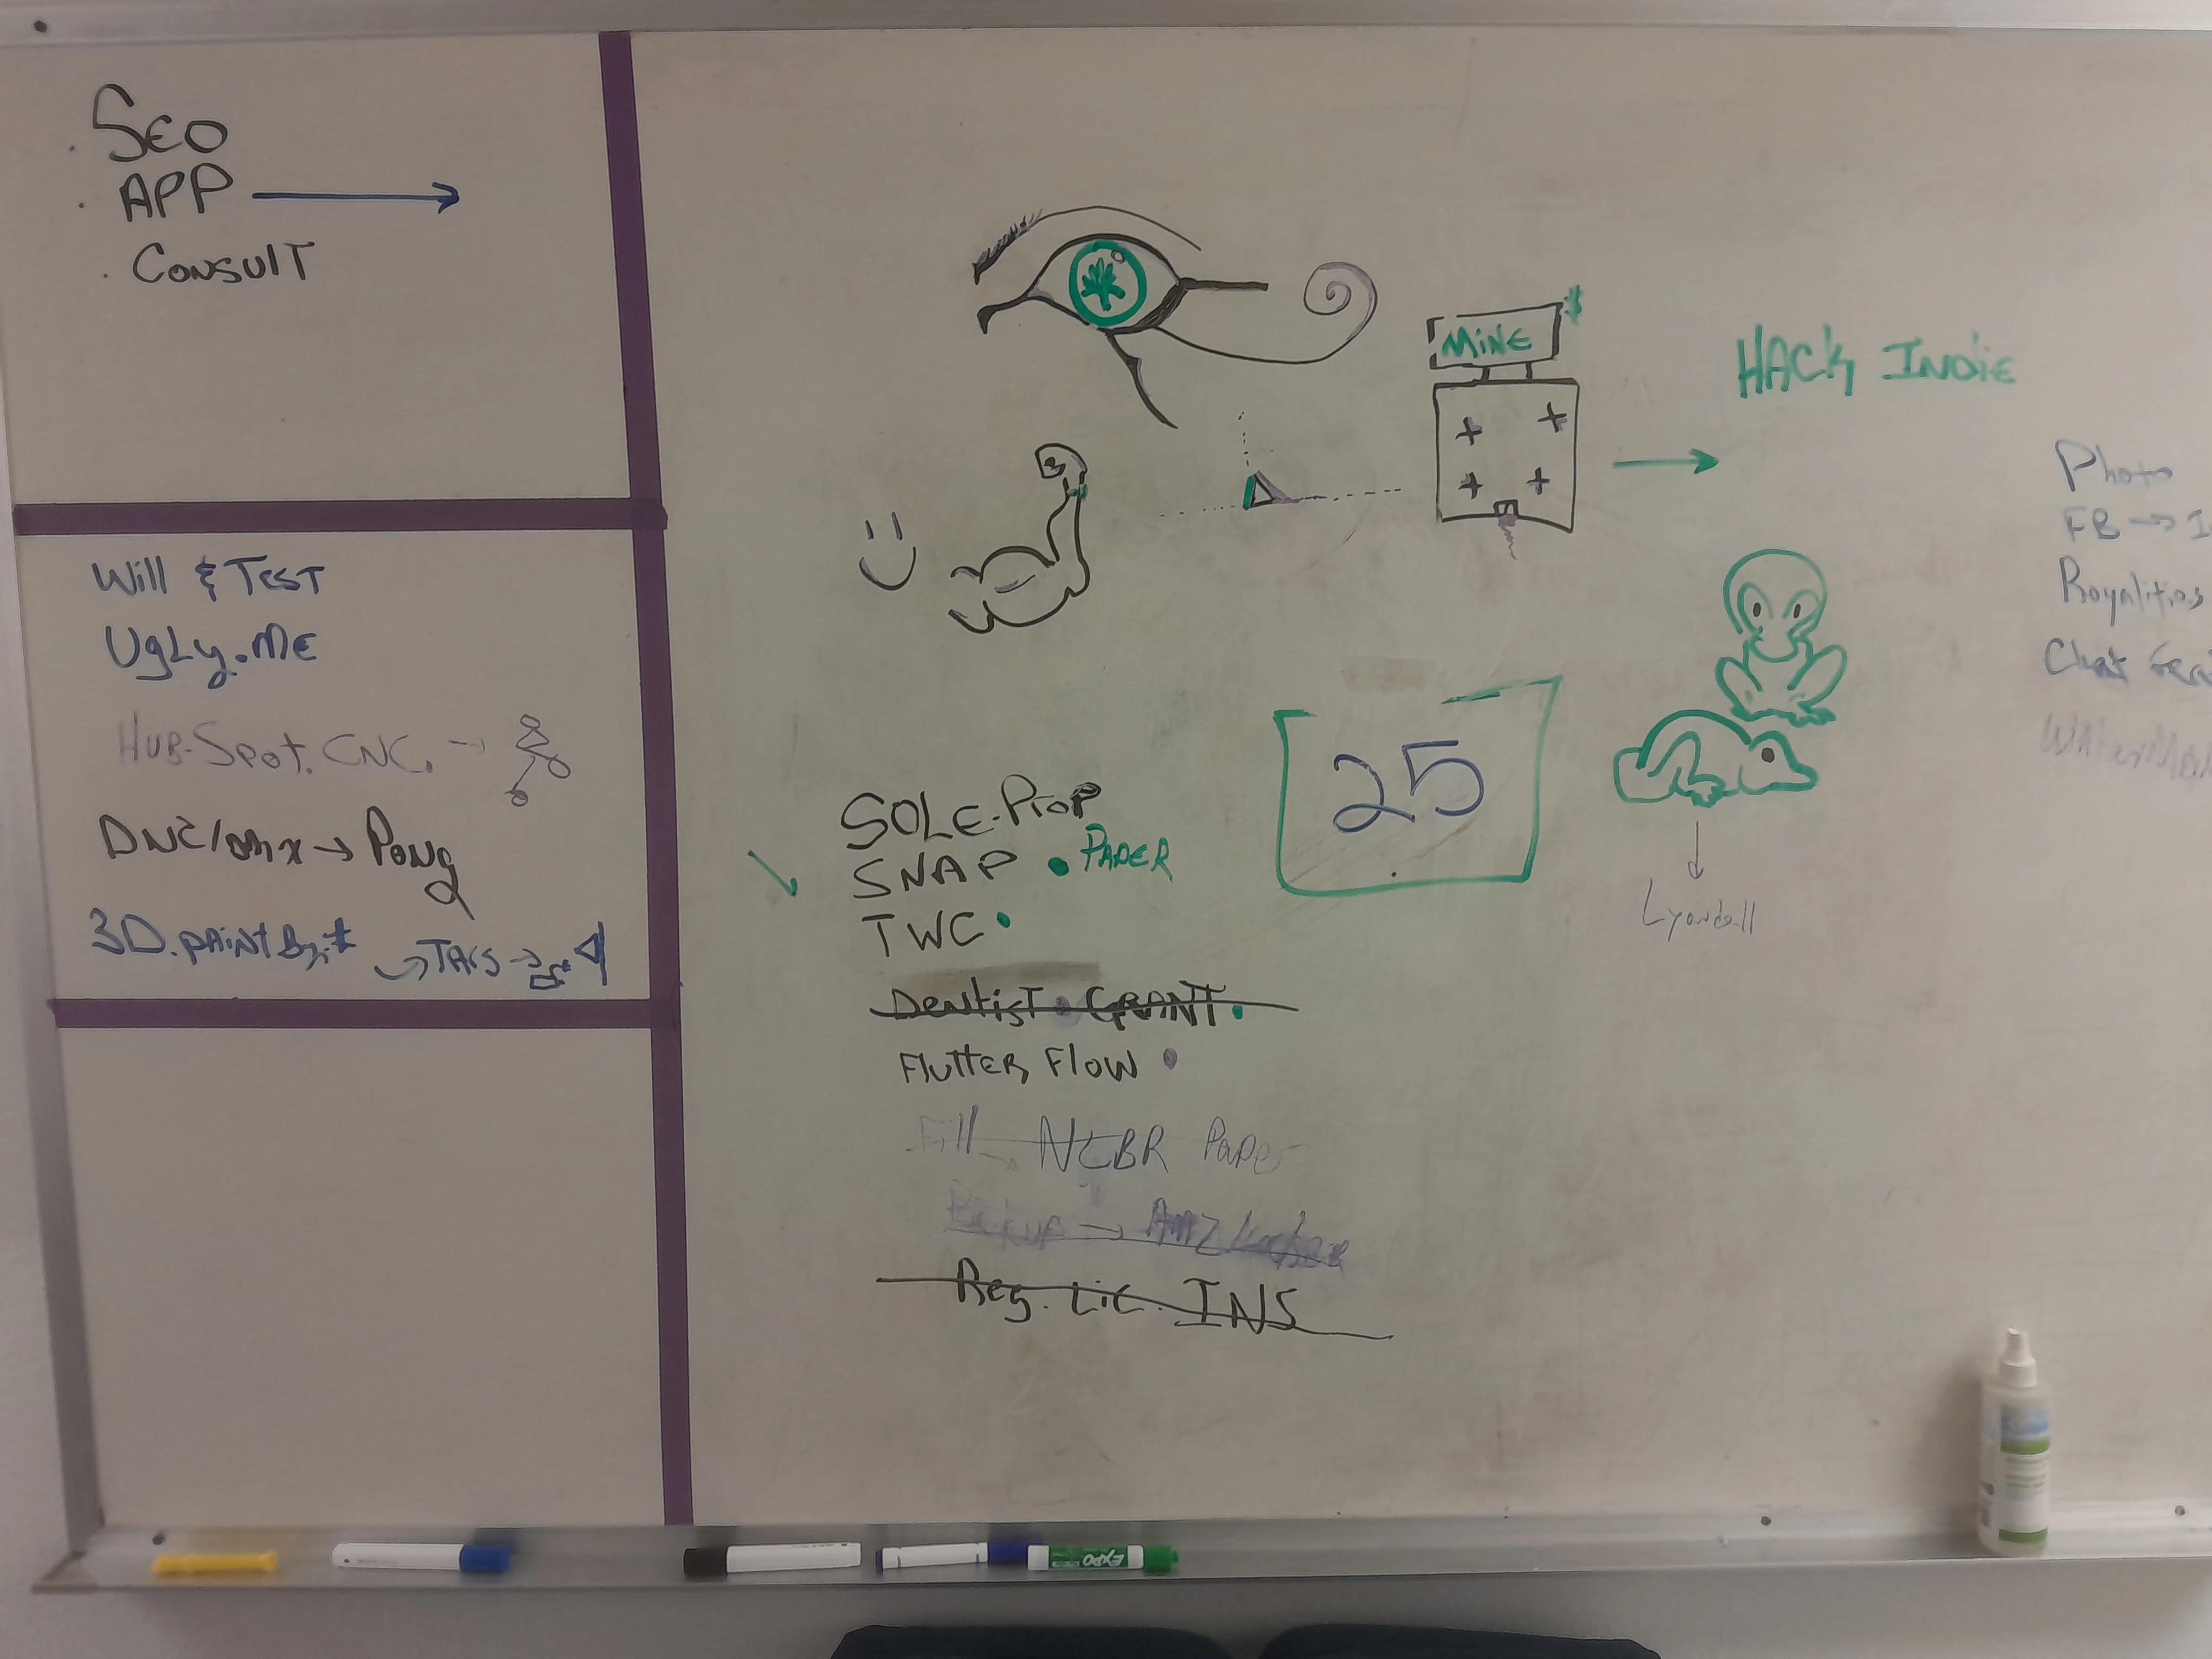
Figure 3: Rapid Application Development pipeline modeling: rapid decoupling and iteration at zero compute overhead.
Cycle-Time Compression
Consider the feedback loop of discovering an architectural flaw. If an engineer models a distributed data pipeline directly in code, discovering a circular locking condition or an unindexed join path requires writing boilerplate, provisioning infrastructure, constructing test fixtures, and running build pipelines—a cycle that consumes hours or days.
On a whiteboard, that same circular dependency is caught in seconds. When your marker is forced to draw a line that loops unexpectedly back through a state manager that is already locked by an upstream worker, the architectural dead-end reveals itself visually. You swipe the felt eraser across the marker stroke, eliminate the faulty dependency, redraw the decoupling queue, and solve the problem before writing a single character in an IDE.
Decoupling Architecture from Syntax
One of the greatest hazards in software engineering is confusing implementation syntax with architectural soundness. Junior developers often rush into their code editors, immediately wrestling with package dependencies, type definitions, and framework boilerplate while remaining blind to the foundational structural flaws of the system.
Whiteboarding enforces a strict cognitive separation:
- Macro Topology on the Board: Is the data flow unidirectional? Are state boundaries isolated? Can subsystems scale independently without cascading failures?
- Micro Implementation in Code: Once the board validates the architectural topology, writing the actual code becomes an act of transcription rather than discovery.
By front-loading structural experimentation to the physical board, RAD teams eliminate the costly “refactor-in-code” loops that derail sprint timelines.
4. The Chromatic Code: Color Taxonomy and Semantic Discipline
A common mistake made by novices is using whiteboard markers as decorative coloring tools, picking hues randomly based on whichever pen is closest at hand. In rigorous architectural diagramming, color is a semantic coordinate system. Every color must carry an immutable, predictable definition across every square foot of the board.
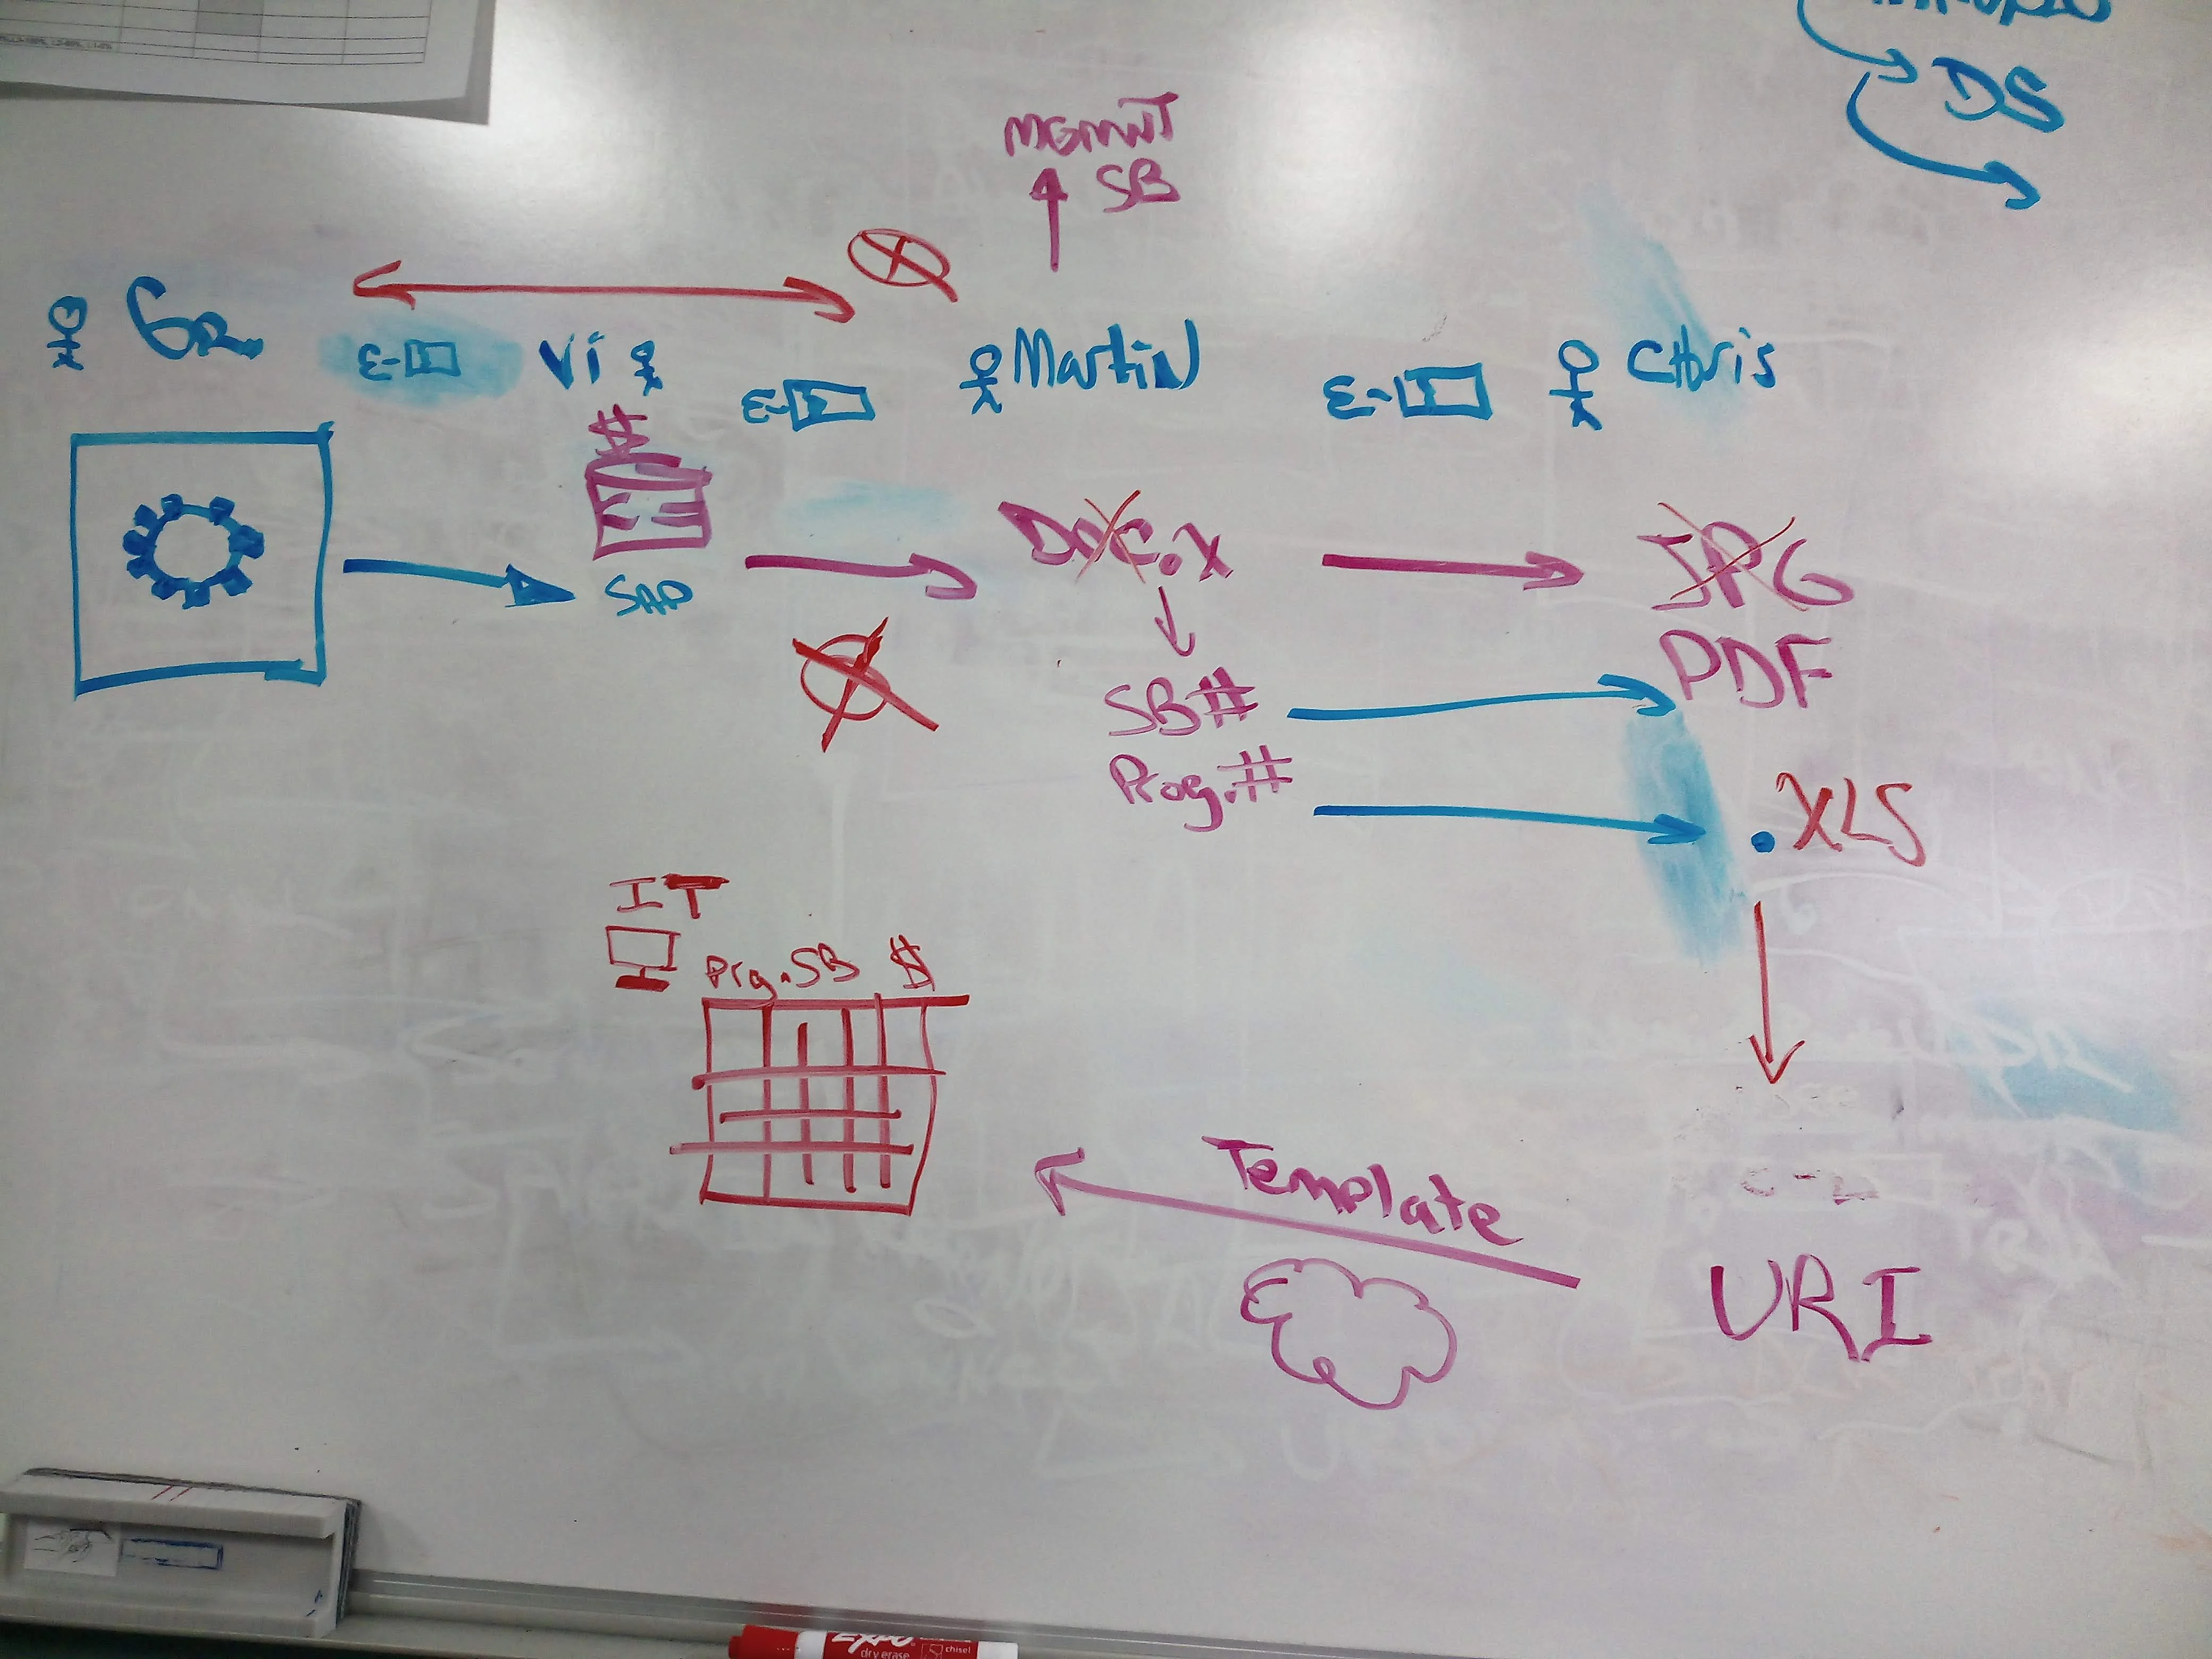
Figure 4: Rigorous chromatic discipline: black for skeleton, blue for data states, and red for architectural boundaries.
The Standard Five-Color Architectural Palette
- Black — The Structural Skeleton & Topology: Black is the bedrock. It is used exclusively for primary subsystem perimeters, module boxes, main directional flow lines, structural swimlanes, and neutral text labels. It establishes the physical geography of the system. If you take away all other colors, the black ink alone should provide a coherent structural skeleton.
- Blue — State, Schemas & Payload Flow: Blue represents data in transit and data at rest. It outlines data structures, table schemas, payload contracts, column mappings, cache entities, and query vectors. When an arrow carries information rather than pure execution control, blue identifies the shape, rate, and format of that payload.
- Red — Critical Paths, Bottlenecks & Security Boundaries: Red is reserved strictly for tension and danger. It marks network latency ceilings, single points of failure, rate limits, lock contention points, unauthenticated perimeter borders, memory thresholds, and strict error-handling branches. Red immediately draws the eye to where the system is most vulnerable to collapse.
- Green — Validations, Deployment Gates & Health Metrics: Green signals affirmative verification. It is applied to health check probes, validation success paths, authorization tokens, telemetry emission targets, test pass criteria, and production deployment boundaries. It represents the verified, healthy path through the system.
- Purple or Orange (Secondary Accents) — Asynchronous Eventing & Third-Party APIs: When secondary accents are required, orange or purple designates asynchronous message buses, Kafka topic partitions, pub/sub queues, and external third-party partner dependencies that operate completely outside the core application lifecycle.
When this color taxonomy is maintained with military discipline, anyone walking past the board can decode the health and risk profile of a system within five seconds simply by evaluating the concentration of red marks against the black structural frame.
5. Why Whiteboard Instead of Software: The Cognitive Case
Why stand before a physical piece of laminated composite on a wall when tools like Figma, Miro, Draw.io, and Lucidchart offer infinite canvases, automated alignment grids, cloud version control, and collaborative cursor sharing?
The answer lies in human cognitive architecture.
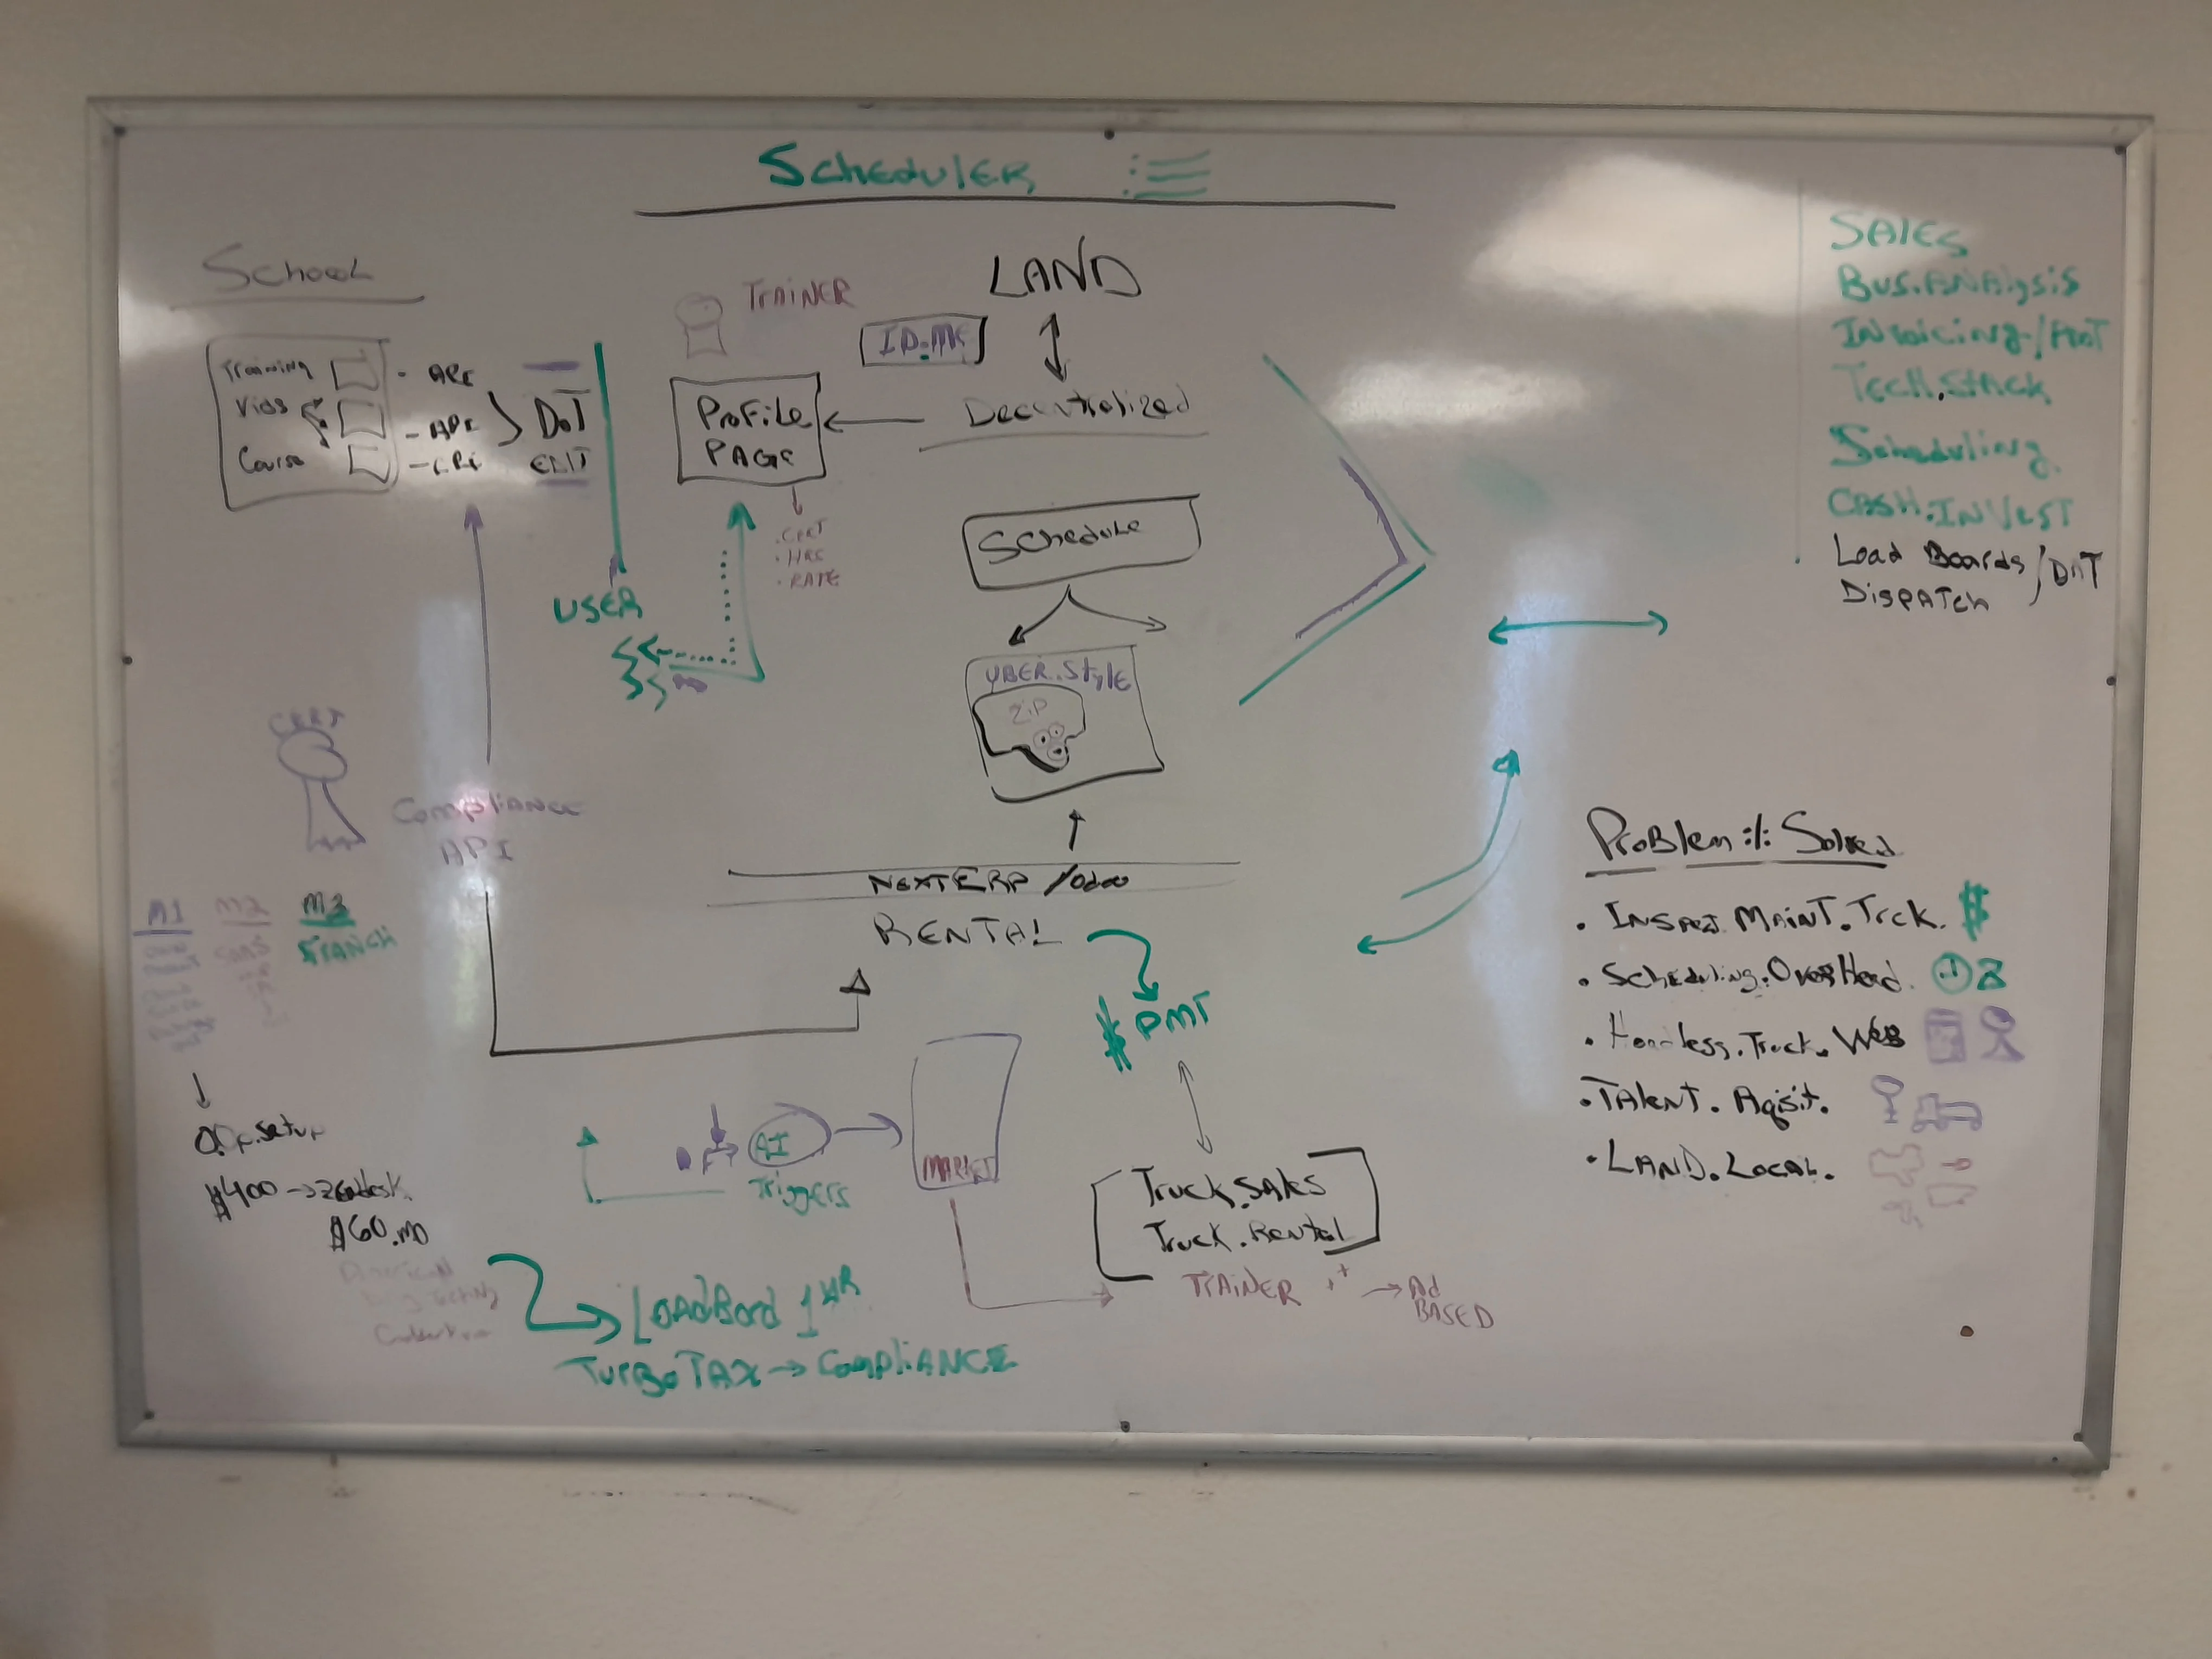
Figure 5: Spatial cognition in action: the expanse of physical wall space activates broad peripheral awareness.
The Screen's Peephole Effect vs. Full Peripheral Vision
When working in diagramming software, an engineer is trapped looking through the “peephole” of a 14- to 27-inch monitor. To inspect a complex system, the user is constantly zooming in to inspect node labels, zooming out to see the whole, and panning left and right. This incessant zooming and panning fragments spatial memory. The brain is forced to expend valuable cognitive cycles simply keeping track of where it is on the digital canvas.
A 6×4 foot or 8×4 foot physical whiteboard occupies the engineer's entire visual field. The human visual cortex has evolved over hundreds of thousands of years to navigate physical space using peripheral vision. When standing in front of a physical board, you can focus with high-resolution foveal vision on a specific database transition in the lower right corner, while your peripheral vision maintains uninterrupted spatial awareness of the entire ingress pipeline in the upper left. This continuous, unfragmented spatial awareness is fundamentally impossible on a computer monitor.
Kinesthetic and Embodied Reasoning
Thought is not purely disembodied logic; it is deeply tied to physical bodily action. Standing upright, pacing across the room, stepping backward four paces to evaluate symmetry, reaching upward to sketch an ingress gateway, and crouching to draw a low-level storage driver engages the motor cortex and full-body kinesthetic feedback loops. Physical movement elevates heart rate, stimulates cerebral blood flow, and breaks the mental stagnation that inevitably sets in when hunched motionless over a keyboard.
Zero-Friction Velocity and Freedom from Tool Artifacts
Digital tools impose artificial constraints. In software, you are constantly fighting snapping grids, adjusting connector elbow routes, selecting drop-down menus, and resizing boxes to fit text. These are tool artifacts—distractions born of the software itself that have nothing to do with solving the engineering problem.
A dry-erase marker has no menus, no hotkeys, no subscription fees, no battery requirements, and no latency. If you want a box twice as large, you draw it twice as large in a tenth of a second. If you want an irregular curved path connecting two disparate nodes, your wrist traces the path instantly. The friction coefficient between mind and medium is zero.
6. The Cubicle Dynamic: Intentional Psychological Impact on Management
Beyond its direct computational and architectural utility, a massive, densely populated whiteboard within an engineering workstation or cubicle carries immense organizational and psychological significance.

Figure 6: The cubicle whiteboard as an ambient visual signal of intense cognitive labor and architectural rigor.
What People Management Sees When Stepping In
When engineering directors, department heads, project managers, or business stakeholders walk down a hallway of cubicles, their eyes scan the physical environment for signals of velocity, competence, and clarity.
When they step into a workstation where the walls are dominated by a massive, impeccably structured, multi-colored architectural flow diagram, the psychological impact is instantaneous:
- Unspoken Technical Authority: A dense, coherent whiteboard diagram is an undeniable physical proof-of-work artifact. It demonstrates that the engineer is not merely tweaking lines of code or browsing documentation, but is holding the entire, multi-variable architectural topology of the system in active working memory. It radiates rigor, depth, and mastery.
- Transparent Complexity: Non-technical leadership frequently underestimates software complexity because code on a screen looks like uniform text files. A complex whiteboard makes complexity physical and visible. When management sees three distinct asynchronous layers, five critical red failure boundaries, and a multi-tiered data transformation pipeline laid out in ink, they intuitively understand why an initiative requires careful thought, rigorous testing, and proper timeline allocation.
- The Defensive Perimeter Against Trivial Interruptions: In an open-office or cubicle environment, engineers are perpetually vulnerable to drive-by interruptions—casual, low-priority questions that obliterate hours of deep focus. A wall-sized whiteboard diagram operates as a visual deterrent. When an executive walks into a cubicle intending to ask a casual question and finds themselves confronted by a sprawling, active diagram with arrows tracing complex state transitions, their immediate social reaction is deference. They instinctively recognize an environment of intense cognitive focus, pause at the threshold, and ask: “Is this a bad time? Let me know when you have a natural stopping point.”
- Rapid Alignment Forcing: When a crisis strikes, an executive demands an update, or a debate arises regarding feature feasibility, the whiteboard is the ultimate alignment tool. You do not spend thirty minutes assembling a slide deck or sharing a messy digital screen. You stand up, hand a marker to the stakeholder, point directly to the red bottleneck on the board, and say: “Here is the throughput ceiling. If we add the requested feature here, this queue overflows and this database lock escalates. Which trade-off do you want to make?” The conversation moves from vague corporate abstractions to concrete spatial realities in thirty seconds. Consensus is immediate and decisive.
7. The Physical Mechanics: Surface, Ink, and Archival Rituals
To execute professional whiteboard diagramming, the tactile craft must be treated with the same precision as software development tooling.
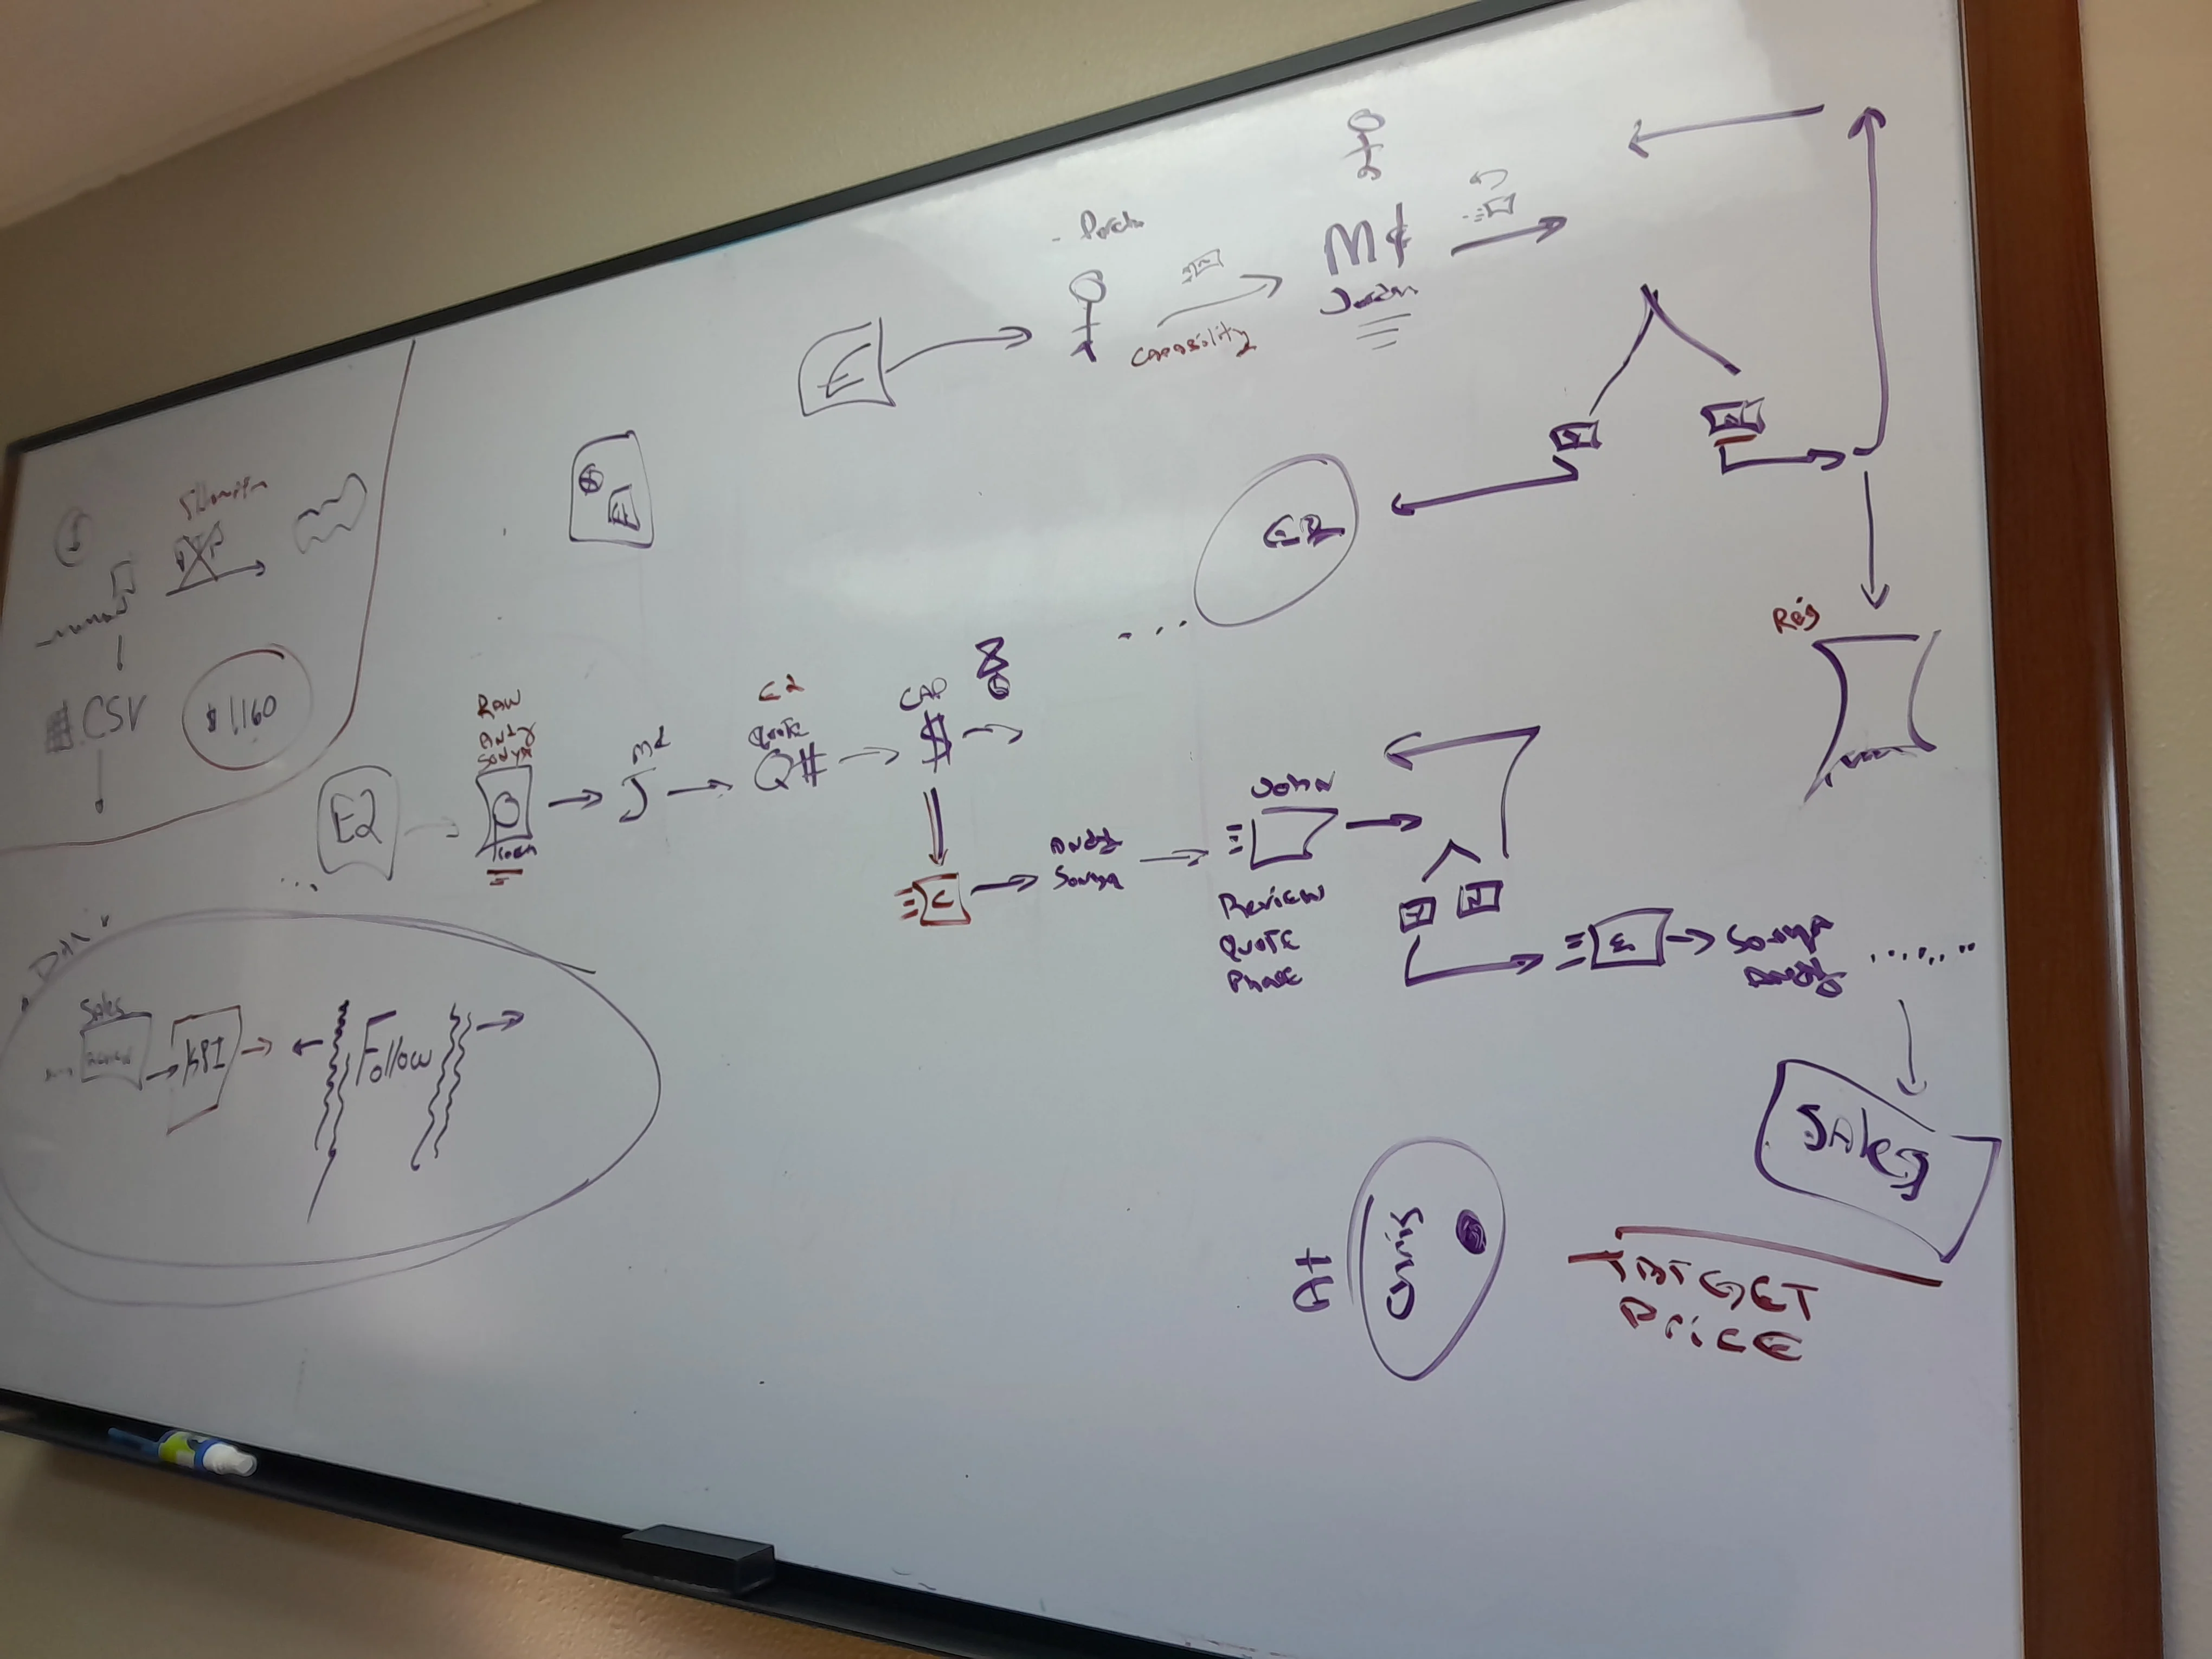
Figure 7: Precision marker lines, deliberate erasure boundaries, and high-contrast dry-erase presentation.
Board Selection and Maintenance
- Surface Material: Avoid cheap melamine boards that absorb ink and degrade into blurry gray smears within six months. Insist on porcelain-on-steel or tempered glass magnetic boards. Porcelain magnetic surfaces provide ultra-high contrast, resist marker ghosting, and allow physical magnetic tokens (or color-coded magnets) to be pinned directly alongside marker flows.
- Marker Selection: Use chisel-tip markers for outer bounding boxes and structural conduits—the broad edge creates bold, authoritative strokes visible from twelve feet away. Use fine bullet-tip markers exclusively for node labels, algorithmic formulas, and micro-annotations.
- Erasing Protocol: Standard felt erasers are designed for quick wiping during live sparring sessions. For end-of-day board resets, use microfiber cloths lightly misted with 90% isopropyl alcohol or specialized whiteboard cleaner to eliminate solvent residue and restore absolute optic brilliance.
The Photographic Archival Ritual
A whiteboard is ephemeral by design, but its architectural insights must not be lost. Before wiping a major diagram to begin the next iteration:
- Step back directly perpendicular to the board to minimize parallax distortion.
- Ensure overhead fluorescent or LED lighting does not cast hot specular glares across key nodes.
- Capture a high-resolution smartphone image.
- Export the image into the project repository or engineering documentation hub alongside the sprint ticket.
Over years of engineering leadership, these snapshots form an invaluable chronological archive of architectural evolution, showcasing the iterative progression of your systems thinking from raw initial sketch to bulletproof production deployment.
8. Conclusion: The Board as an Intellectual Extension
Whiteboarding is not an outdated vestige of pre-cloud computing; it is a timeless discipline of cognitive amplification. In systems architecture, where the primary challenge is managing cognitive load across distributed, interconnected variables, the whiteboard remains the purest bridge between abstract thought and concrete reality.
By mastering the geometric grammar of flow diagrams, maintaining strict chromatic discipline, leveraging the frictionless velocity of Rapid Application Development, and understanding the profound organizational psychology of physical engineering artifacts, an architect transforms an ordinary wall of dry-erase porcelain into a powerhouse of clarity, leadership, and technical authority.